Contents
- 1 Handling Missing Data – Abstract
- 1.1 Introduction – Handling Missing Data
- 1.2 Handling Missing Data
- 1.3 Experiment
- 1.4 Results and Discussion
- 1.5 The affection of Missing Generator and Handling Method
- 1.6 Recap
- 1.7 Reference
- 1.8 Data Science Blog
- 1.9 Hiring Data Scientist / Engineer
- 1.10 AI / Data Science Project
- 1.11 Vietnam AI / Data Science Lab
Handling Missing Data – Abstract
The article discusses various types of missing data and how to handle them. We demonstrate how the prediction results are affected by the quality of missing data as well as the method of handle missing data through some experiments.
-
Introduction – Handling Missing Data
For any real data set, missing data is almost unavoidable. There are many possible reasons for this phenomenon including changes in the design of data collection, precision of data that users entered, the unwillingness of participants surveyed when answering some questions, etc. Detecting and handling these missing values are problems of the data wrangling process.
There are 3 major types of Missing data:
- Missing Completely at Random (MCAR): this is the random case. The missing record is just random and there is no correlation between any value between the missing values and values in other variables.
- Missing at Random (MAR): this type of missing means that the propensity for a missing point is not related to the missing data, but some of the observed data. For example, in a market research survey, for any reason, some interviewers (of some cities) forgot to ask about the income of interviewees, which lead to the ratio of missing income values in these cities higher than other ones. We can consider this as Missing at Random.
- Missing Not at Random (MNAR): this is a highly biased case. The missingness is related to the value of missing observation. In some cases, the dataset should be re-collected to ensure not to have this type of missing. For example, interviewees with high income rejected to answer about their figure could cause this type of missing.
-
Handling Missing Data
Ignoring
Yeah, you just ignore it, if you know missing data is MCAR. Although you do not do anything by yourself, the library (such as XGBoost) is the one that does the stuff for you by choosing an appropriate method. So technically, we can count this method as cases of other methods, depends on circumstance.
Removing (Deletion)
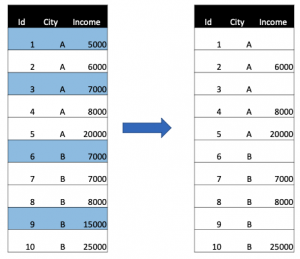
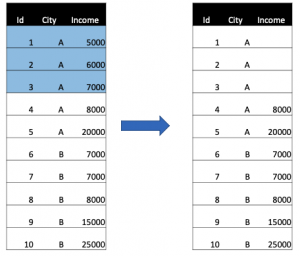
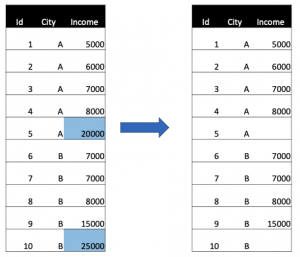
- Column deletion: another simple to handling missing data is to remove that attribute (column deletion). It can be applied when the missing record ratio is high (should be at least 60%, but this is not a fixed rule) and the variable is insignificant.
- Row deletion: If the missing value is MCAR and the missing ratio is not very high, we can drop the entire record (row). This method can be acknowledged as listwise deletion. But if the missing case is not MCAR, this method could introduce bias to a dataset.
- Pairwise deletion: instead of completely removing unknown records, we will maximize data usage by omitting only when necessary. Pairwise deletion can be considered as a method to reduce the data loss caused by listwise deletion.
Imputation (Fill-in)
- Imputation with Median/Mean/Mode values: these values are usually used to fill the missing position. Most of the time, the mean value is used. By using the mean value, we are keeping the mean unchanged after processing. In case of a categorical variable, the most popular value (mode) can be used to fill. The imputation method could decrease the variance of the attribute. We could extend the imputation by adding information whether value comes from imputation or from original dataset value using boolean type (this technique can be called marking imputed values in some document). However, one must be aware of using this method, if the data missing is not random, using mean can introduce outliers to the data.
- Algorithm-based Imputation: instead of using a constant for imputing missing values, we could model variables with missing values as a function of other features. A regression algorithm can predict them with some assumptions.
- If a linear regression is used, we must assume that variables have linear relationship.
- If predicting missing values based on the order of high correlated columns, the process is called hot-deck imputation.
- KNN Imputation: this method can be considered as a variant of median/mean/mode imputation, but instead of calculating these values across all observations, it only does among K nearest observations. One question we should think about is how to measure the distance between observations.
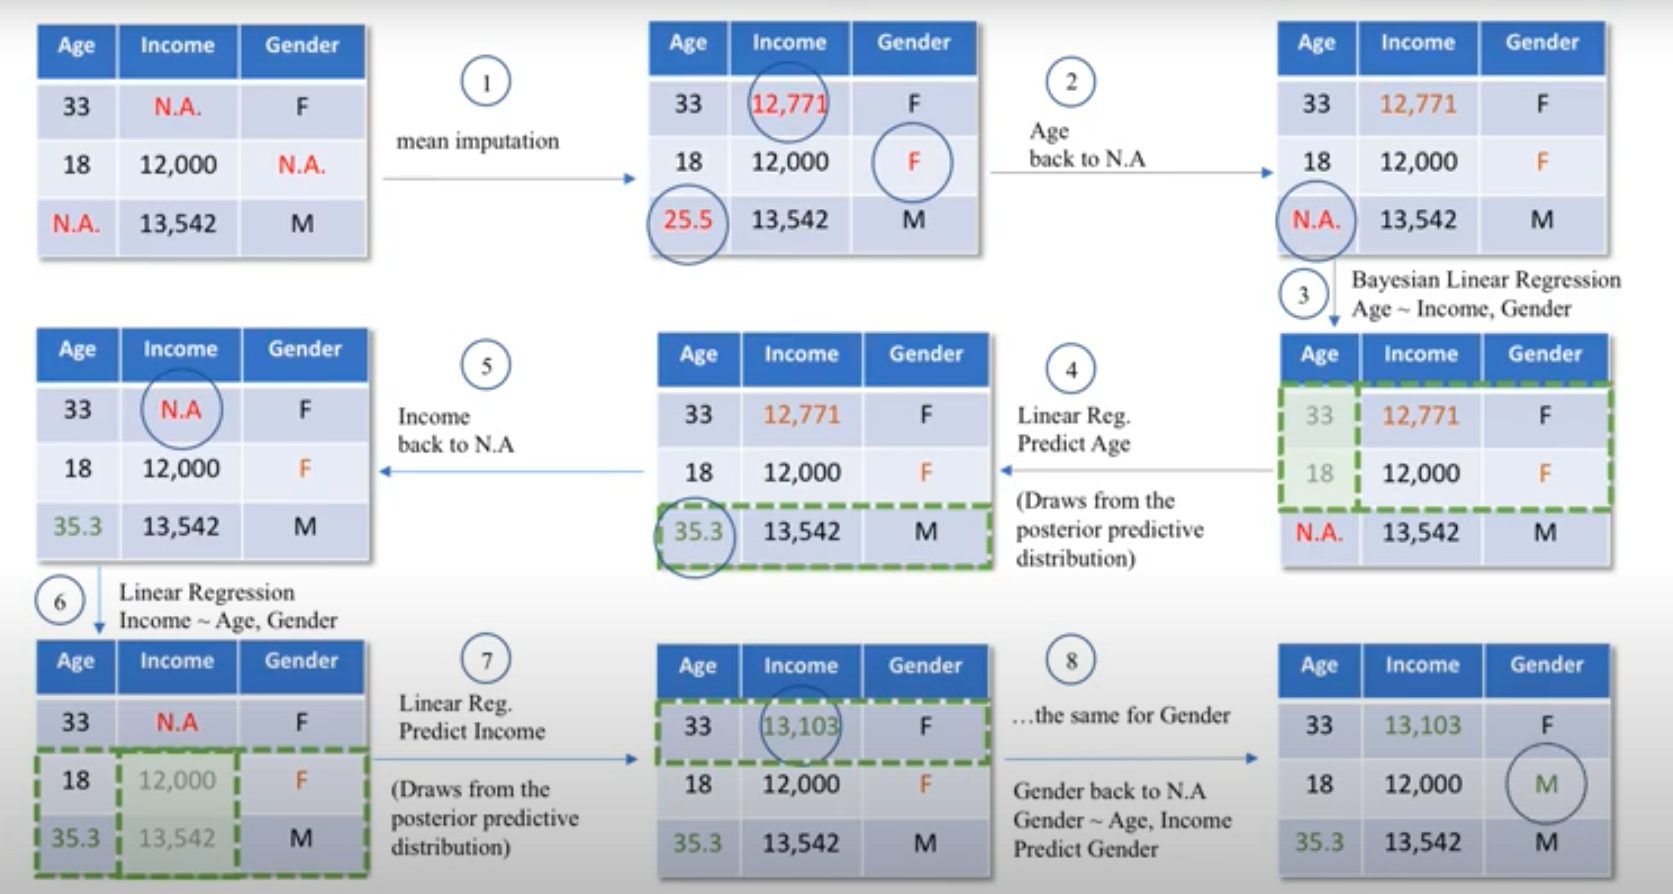
- Multivariate Imputation Chained Equations: instead of the imputation value of each column separately, we can repeat to estimate missing values based on the distribution of other variables. The process repeats until data become stable. This approach has two settings: single and multiple data sets (can also be mentioned as Multiple Imputation by Chained Equations – MICE).
-
Experiment
We are using the Titanic dataset for the experiment, which is quite familiar to most data scientists. The original data consist of 12 variables includes categorical variables and numerical variables. The original task is predicting whether each passenger is survived or not.
We will do a classification task with Logistic Regression (fixed among trials). In each experiment, we try to simulate the situation of data missing by removing some existing values from some features of input data. There will be 2 ways to removing data: completely random (MCAR Generator) and random (MAR Generator). Consider MAR Generator, in each trial, values will be removed with a different ratio based on values of other features (in particular, we based on Pclass – a highly correlated variable with Survived status). We track the changing of accuracy across different settings. For cross-validation, we apply K-Fold with K=5.
In experiment 1, we observe the changing of accuracy when we removing different amounts of data from some features.
In experiment 2, we generate missing data using MCAR and MAR Generator and use 2 MCAR-compatible methods to handle them. We will find out whether these methods decrease the accuracy of the classifier model.
-
Results and Discussion
The affection of Missing Data Amount
In this experiment, we will try to find the correlation (not the correlation coefficient but the correlation in general) between the amount of missing data and the output of learning models, as well as the method to handle them. We do this by masking different ratios of a few columns with an MCAR setting.
| Pct Ratio (%) |
Masking Sex, Dropping Title | Masking Age, Dropping Title | Masking Age, Sex, Dropping Title | Masking Age, Sex, Keeping Title | ||||
| 0 | 81.04 | 0 | 81.04 | 0 | 81.07 | 0 | 82.21 | 0 |
| 20 | 77.23 | -3.81 | 81.19 | 0.15 | 77.53 | -3.54 | 81.83 | -0.38 |
| 40 | 75.17 | -5.87 | 80.84 | -0.2 | 75.41 | -5.66 | 81.87 | -0.34 |
| 60 | 73.96 | -7.08 | 80.29 | -0.75 | 73.93 | -7.14 | 82.32 | 0.11 |
| 80 | 71.95 | -9.09 | 79.58 | -1.46 | 71.92 | -9.15 | 82.69 | 0.48 |
| 99 | 71.48 | -9.56 | 79.5 | -1.54 | 71 | -10.07 | 82.98 | 0.77 |
Figure 3: Affection of Missing Ratio. The columns just right to each accuracy columns show the difference between the original (0%) and current setting
As can be seen, the more values are removed, the more accuracy decreases. But it happens only under some settings.
The Missing Data quantity is affected significantly only if the feature brings “unique” information. With the presence of the Title feature (extracted from Name), the missing values in the Sex column do not decrease the performance of the model, even with 99% missing data. It is because the majority of values of the Title column (Mr, Mrs, Ms, Dr…) induced information of Sex columns.
With the existence of some features that are important and highly correlated with missing features, the missing data effect becomes negligible. One thing we can learn that although its simplicity, removing entire variables should be considered in many cases, especially if some features that highly correlate with missing features. This can be valuable if we do not want to sacrifice performance and waste effort to gain a small portion of accuracy (around 1%).
The affection of Missing Generator and Handling Method
In this experiment, we use MCAR and MAR simulators to create modified datasets. With each removing method, we apply numerical columns (Age and Fare). Then, we use Mean Imputation (so we choose numerical features for removing values) and Listwise Deletion, which compatible with which MCAR setting, to handle these missing values and observe the difference of accuracy.
Handling by Mean Imputation
| Missing ratio | MCAR Missing Generator (Age) | MAR Missing Generator (Age) | Difference |
| 0 | 81 | 81 | 0 |
| 20 | 80.97 | 80.99 | -0.02 |
| 40 | 80.72 | 80.7 | 0.02 |
| 60 | 80.04 | 80.38 | -0.34 |
Handling by Listwise Deletion
| Missing ratio | MCAR Missing Generator (Age) | MAR Missing Generator (Age) | Difference |
| 0 | 79.24 | 79.24 | 0 |
| 20 | 78.69 | 77.85 | 0.84 |
| 40 | 78.81 | 76.59 | 2.22 |
| 60 | 80.65 | 77.34 | 3.31 |
Figure 4: Different Missing Generators with different MCAR Handling Methods
Once again, we notice that with Mean Imputation, there are not any significant improvements when we use the MCAR Missing Generator instead of the MAR one. We can see that although Mean Imputation (which is considered as an MCAR-compatible handling method) can distort the correlation between features in case of MAR Missing Generator, the classification task can achieve comparable accuracy.
On the other hand, in case of using Listwise Deletion, the classifier accuracy is higher when the handling method is synced (MCAR Missing Generator). This can be explained by doing listwise deletion, we also throw data from other variables away. So in the MAR Generator case, we removed rows with an unrandom mechanism (it is still removed randomly in the MCAR Generator case), which worsen the classifier’s accuracy. Note that in one column, there is an increase in 60% setting. This phenomenon happens because by removing more rows, both the training and testing folds become smaller. We should not consider this as an improvement of the model when we increase the missing ratio.
-
Recap
All methods of handling missing data may be helpful, but the choice is based on the circumstance. For better choice, data scientists should understand the process that generated the dataset, as well as the knowledge of the domain.
Considering the correlation between features are important to decide whether missing data should be handle or just ignore or delete from the dataset.
There are also some aspects of handling missing data we want to show you but due to time and resource limitation, we have not done these experiments yet. We would want to do experiments with more complex methods such as algorithm-based handling, as well as compare the affection over different datasets. We hope to come back to these problems some days.
Reference
https://seleritysas.com/blog/2020/03/03/the-best-way-to-handle-missing-data/
https://towardsdatascience.com/how-to-handle-missing-data-8646b18db0d4
https://www.kaggle.com/dansbecker/handling-missing-values
https://www.inwt-statistics.com/read-blog/understanding-and-handling-missing-data.html
https://scikit-learn.org/stable/modules/impute.html
Multiple Imputation by Chained Equations (MICE): https://www.youtube.com/watch?v=zX-pacwVyvU
Data Science Blog
Please check our other Data Science Blog
Hiring Data Scientist / Engineer
We are looking for Data Scientist and Engineer.
Please check our Career Page.
AI / Data Science Project
Please check about experiences for Data Science Project
Vietnam AI / Data Science Lab