Contents
If B=1 (unbiased), it means there are the same number of rain points forecast as actually observed rain points.
If B>1 (over-forecast), it means more rain points are forecasted.
If B<1 (under-forecast), it means fewer rain points are forecasted.
- Skill Score (SS): This measure is used to check out the percentage improvement between models base on accuracy score (i.e. hit rate)
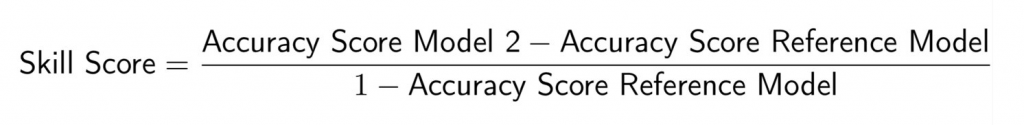

Figure 4: Skill score between model 1 and model 2 across 60 minutes
From Figure 4, we can see that Model 2 shows at least 2% improvement in accuracy compared to Model 1. We also observe that at a later stage in the forecast time step (after 40 minutes), Model 2 shows up to 6% improvement inaccuracy.
Conclusion
The choice of metrics can influence how we evaluate the performance of a particular model. It is important to choose the correct metric as it can affect our model selection step.
Reference
[1] Wikipedia, https://en.wikipedia.org/wiki/Confusion_matrix
[2] Mohammed Sunasra, “Performance Metrics for Classification problems in Machine Learning”, medium, https://medium.com/@MohammedS/performance-metrics-for-classification-problems-in-machine-learning-part-i-b085d432082b
[3] wxonline, Verification Measures, https://www.wxonline.info/topics/verif2.html