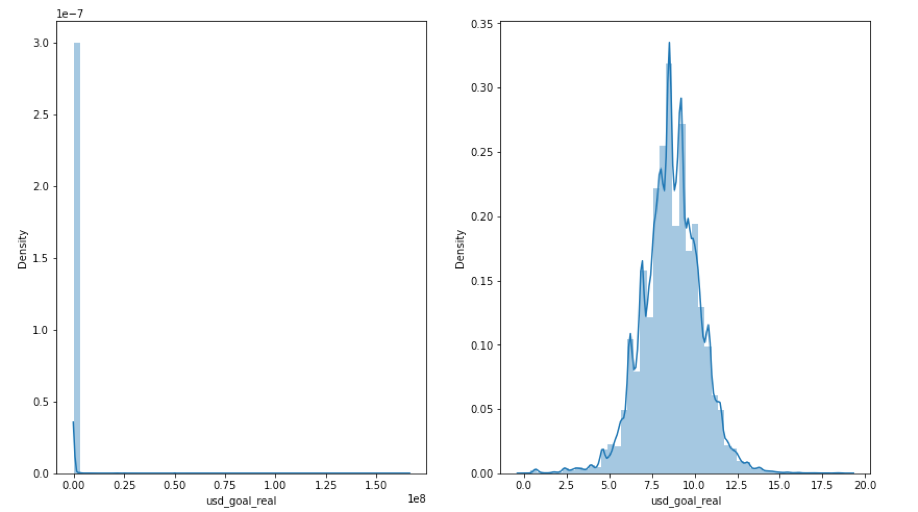
As can be seen from plotting the raw value of goal money, the scale of value is large while data is heavily focusing on a range. Log transformation is useful for better visualization. Binning is also an option for visualization.
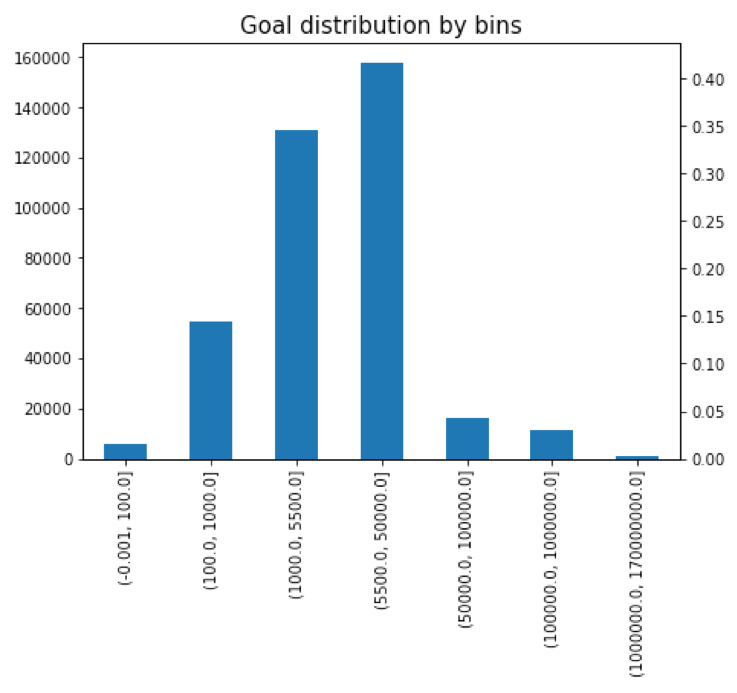
Raw value for goal has to be scaled to be able to use for SVM and Logit model. For started, any scaling method will work so Min-max scaling will be chosen for try out. For the first attempt, binning will not be applied for the moment.
2/Time data
Time data is data related to time. Apart from just having a time value, it also provides the meaning that the data will have a time effect and may follow periodic characteristics. If there are multiple records of one entity in the dataset, then the data include sequential format or for the time it is called time series.
- If a data value is time points, separate features from extracting value in time units (seconds, minutes, hours, date, month, year…) can be made.
- For data to follow periodic aspects, an aggregated feature can be computed.
- In case there is the need to find the expected time points for a phenomenon (example, the expected time or period certain type of event occur), the usual average calculation that would be done for other data cannot represent the expectation well and could cause misleading inference because time in a day is circular data. It is more accurate to take the mean from a Fitted von Mises distribution. Another type of data that has value in a circular range (degree in direction) can also apply this method.
For our data, “launched” and “deadline” is the time aspect of the project. Time information like day, month, year can be extracted for both launch and deadline variables.
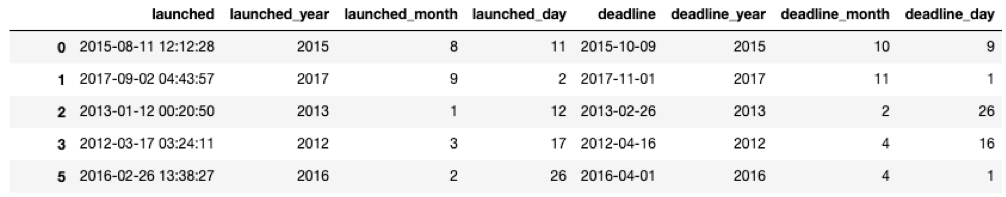
On the other hand, from launch and deadline information, the project duration can be calculated. ‘Duration_Days’ distribution:
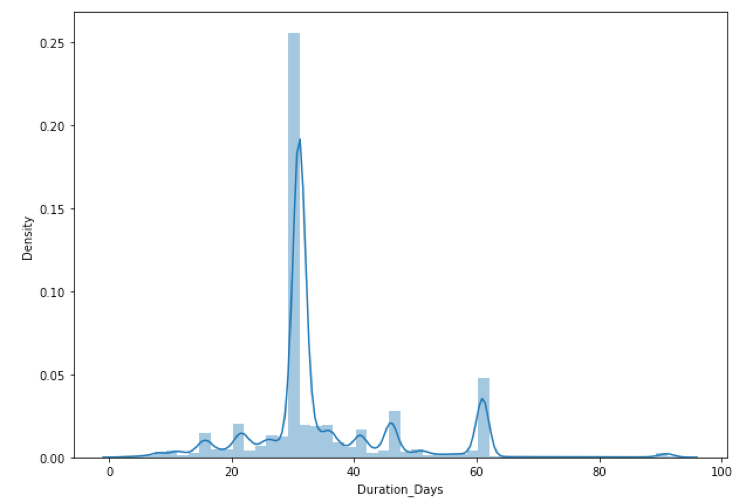
It can be seen that most of the projects will set the funding period to be 1 month (approximately 30 days) or 2 months to a lesser extent. The range for value is not much compared to the goal. Binning the data may clearer the period incentive and follow what seems to be the usual situation for the variable, but this can be left out for the moment also. After finishing the first attempt, testing the binning in the second attempt and comparing the result can be informative.
Since the new feature ‘Duration_Days’ is numerical data, scaling is also needed for the chosen models.
3/ Categorical data
Categorical data is simply data that has categories as value. For this kind of data:
- Encoding or compressing features is the way to handle it. The prior included 3 techniques: one-hot encoding, dummy encoding, and effect coding.
- For large categorical variables, to maintaining both memory efficiency and accuracy with fast training speed, compressing the features by either feature hashing or bin counting are possible approaches.
For this type of data, one of the straightforward ways to compute feature vectors that the model can process is to transform the variable into dummy variables.