Contents
For a better introduction, a specific example that goes through the first iteration of the modeling process will also be included. Since the scope and reasons for the feature engineering is large and cannot be covered in one blog post, the steps and techniques for each stage will mainly be mentioned only and self-research for them is encouraging to be done.
Other parts of the modeling process will also either skip or be done with simple options since those are not the main focus.
Before feature engineering: data intended application and preprocessing
Data
To be able to introduce techniques for many types of data, the Kickstarter data on Kaggle is a good candidate to do so. Kickstarter is a platform to crown funding for creative projects of which the creators go directly to their target audience or consumers for funding. Data can be access here.
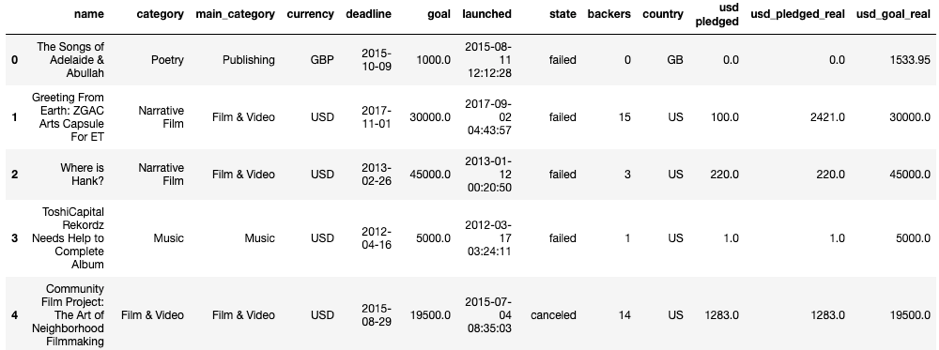
The Kickstarter data is about basic information of projects from 1970 to 2018. The variables in the data are:
- Name: Name of the project
- Main_category: the general categories of the crowdfunded project, in the data there are 15 main categories.
- Category: the detail categories crowdfunded project, which are the subcategories of the main ones. There are 159 categories in the data.
- Currency: Currency of the money for the project.
- Deadline: Final day of the project.
- Launched: Start day of the project.
- Goal: the amount of fund that needs to be gathered
- Country: Countries of the starters (owners of the project).
- Backer: The number of people who have pledged for the project.
- USD pledged: pledged amount turned into USD currency
- USD_pledged_real: actual pledged amount (pledged when backer is not 0) turned into USD currency.
- USD_goal_real: goal turned into USD currency.
Intended application
While there are many directions to produce usages for this data, for simplicity a predictor to guess whether a current Kickstarter project will be a success or not based on past projects will be chosen.
Preprocessing
Preprocessing is the step to put data in a structured format, remove duplication and deal with missing data.
Since this is not the main focus of this article, this step will be explained briefly.
- Data already in a structured format, therefore no need to create a parser to structure the data again.
- For missing data, either they are in an unneeded column or unnecessary data, therefore it is safe to remove them in the dataset.
- As the plan for the predictor is to only predict success or fail state and there is no imbalance happened between those classes, data with other states will be removed.
Feature engineering execution.
While a feature can be fully evaluated its impact only after model evaluation, the ideal to look for features is that features should be informative, low in variance, and not correlated to one another. This would provide the intuition for identifying the features that should be tried first from reviewing the data. To be also clear on the direction of transforming for certain data types, 2 simple models SVM and logistic regression will be chosen.
Looking at the current variables:
- Pledged money and the number of backers cannot be used for a prediction model since those kinds of information can only be finalized at the end of the project and they already defined the project state to a large extent.
- For the variable about goal money, usd_goal_real alone is also enough since it is already the goal money being transferred into 1 currency and there is no Null value in it.
Therefore, the current columns that need to be considered are “name”, “category”, “main_category”, “currency”, “deadline”, “launched”, “pledged”, “country”, “usd_goal_real”. The following parts will go through the variables in group of data types.
1/ Numeric data
Numerical data is the one to have value in numeric value and considered as a fundamental type for feature engineering since most of the other data will come down to numeric representation in the end.
Methods to consider for numeric data:
- Before anything, it is foremost to check data magnitude, scale and distribution because this could determine whether the numeric data need to be transformed into another form or not.
- Options: keep in raw numbers, convert them into binary values or bins, Log transformation (has positive numbers in heavy-tailed distribution) & power transformations.
- For models that are affected by the scale of the input, feature scaling (or normalization) is necessary. Mentioning in there are min–max scaling, standardization (variance scaling), ℓ2 normalization. It is effective when using in situations that involve a great difference in scales of features.
- For some cases, a new feature can be created by doing calculations from 2 or more existing features. This is called feature construction.
In the current dataset, it is the ‘usd_goal_real’